
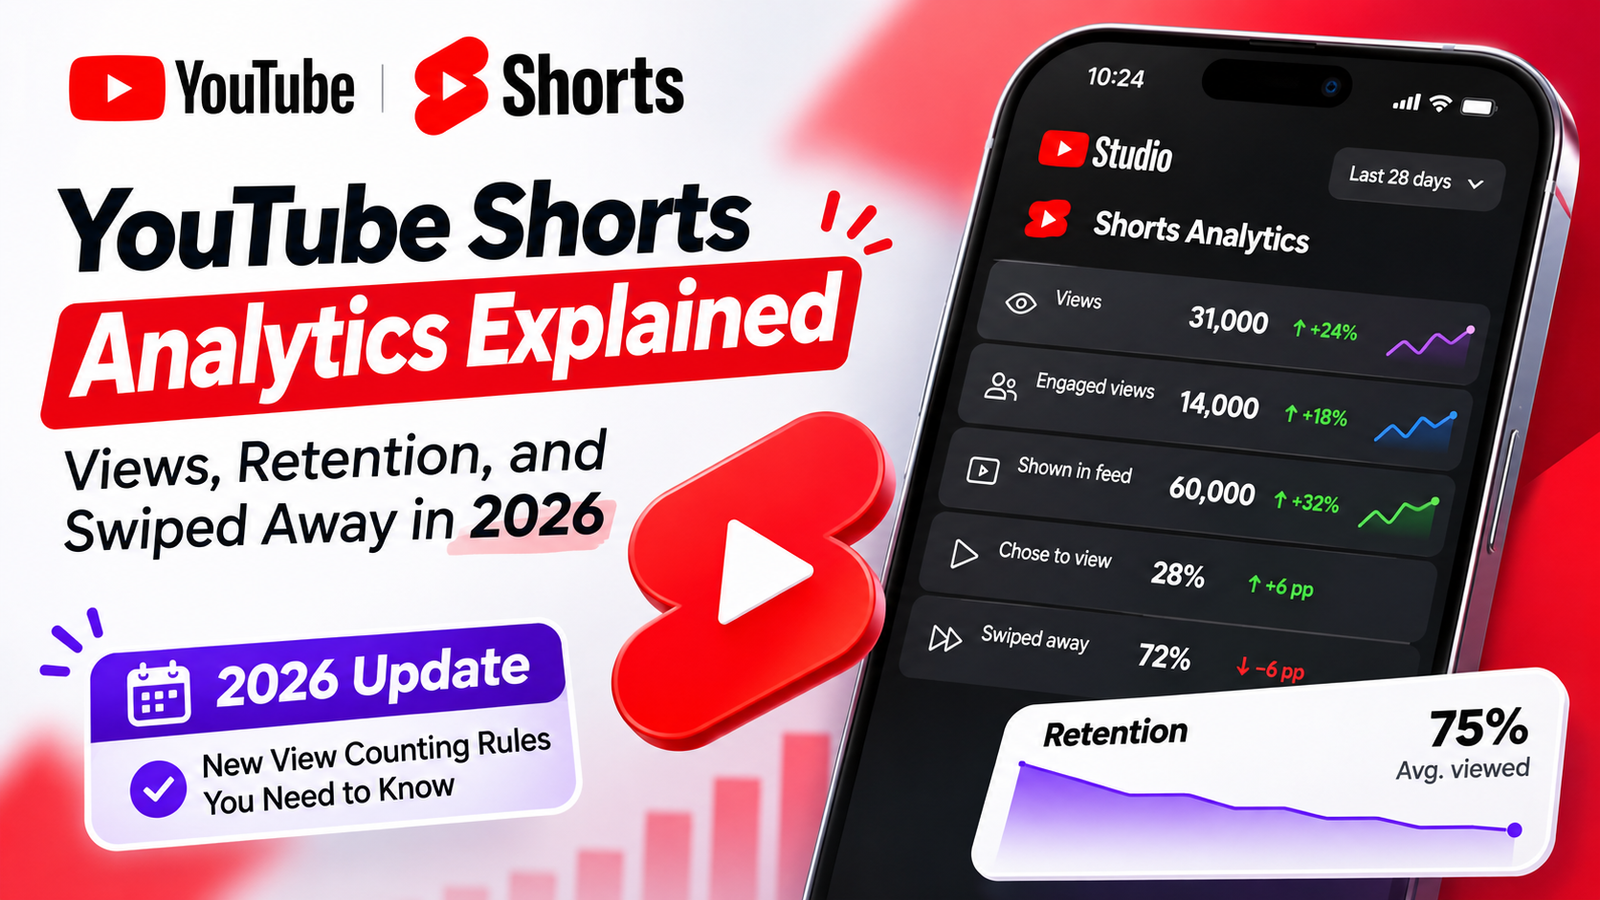
A Short can collect thousands of views while losing viewers immediately. Another may reach fewer people yet hold attention longer. The difference becomes clearer when you separate exposure, watch decisions, and duration. YouTube Shorts Analytics provides those signals, but its labels can be confusing, especially after changes to view counting. This guide explains each metric, provides example reports, and shows what to improve next.
What Changed in YouTube View Counting?
On March 31, 2025, YouTube began counting a Shorts view whenever a Short started playing or replaying, without requiring a minimum viewing duration. The previous Shorts view measure remained available as engaged views, allowing creators to distinguish initial playback from continued attention.
On August 24, 2026, YouTube extended start-of-play view counting across its video formats, including traditional uploads and live streams. The original Shorts playback rule had already changed in 2025.
As a result, public views are useful for measuring playback activity, but they do not necessarily represent people who watched meaningfully. Replays are not equivalent to unique viewers.
For monetization, check YouTube Studio’s Earn tab rather than relying on the public counter. YouTube describes Partner Program eligibility using qualified Shorts views and earnings using engaged Shorts views. Eligibility rules also exclude certain sources and nonpublic uploads.
The Shorts Metrics That Actually Matter
| Metric | What it measures | Best diagnostic use |
|---|---|---|
| Views | Starts and replays counted under current rules | Overall playback activity |
| Engaged views | Plays continuing beyond the initial seconds, excluding loops | Meaningful initial attention |
| Shown in feed | Appearances within the Shorts Feed | Feed exposure |
| Chose to view | Share watching rather than swiping away | Opening effectiveness |
| Swiped away | Share passing without choosing to watch | Early rejection |
| Average view duration | Average time watched among engaged views | Depth of viewing |
| Average percentage viewed | Average proportion watched among engaged views | Retention relative to length |
These measures answer different questions. Views indicate playback began. Shown in feed indicates distribution within one specific surface. Chose to view describes a decision made after exposure. Retention shows how long people who stayed continued watching.
Do not divide engaged views by total public views and label the result your official chose-to-view percentage. The measures have different definitions, and views can arrive from search, channel pages, or external links, not just the Shorts Feed.
Shown in Feed Versus Chose to View
Shown in feed counts appearances in the scrolling Shorts Feed. It does not mean every appearance produced sustained watching. How many chose to view, sometimes presented through Stayed to watch, compares times viewers watched beyond the opening moments with times they swiped away.
Imagine a Short shown 10,000 times in the feed, with 6,200 continued watches and 3,800 swipes. Its illustrative chose-to-view rate would be 62%, while swiped away would be 38%. This illustrates the calculation; Studio remains authoritative.
Low chose-to-view suggests revisiting the first visual, spoken line, pacing, or clarity. However, it does not reveal why a specific person swiped. Weak audience matching, unfamiliar topics, or competitive recommendations may contribute too.
More feed appearances are not automatically evidence of better content. A broadly distributed video can attract viewers who are less interested in its subject, lowering its watch-choice percentage even as total reach grows.
Understanding Retention and Average View Duration
Average view duration measures watch time among viewers who stayed beyond the initial seconds. Average percentage viewed expresses that engagement relative to the video’s duration. YouTube calculates these Shorts measures from engaged views and their associated watch time.
For example, a 40-second Short with an average view duration of 30 seconds has an average percentage viewed of approximately 75%. If another 20-second Short averages 24 seconds, its percentage is approximately 120%, which can reflect repeat watching.
A percentage above 100% does not mean everyone completed the video. Replays can lift the average even when other viewers leave earlier. Likewise, strong retention among engaged viewers does not prove that the opening successfully persuaded most feed visitors to stay.
When available, examine retention changes around identifiable moments: a long introduction, confusing transition, delayed payoff, or abrupt ending. Treat these as hypotheses to test, not proof that one editing choice caused the decline.
Example: Three Shorts With Different Problems
Consider three hypothetical 40-second Shorts published by the same channel. These figures are illustrative, not real account data.
| Metric | Short A | Short B | Short C |
|---|---|---|---|
| Shown in feed | 20,000 | 60,000 | 8,000 |
| Chose to view | 65% | 28% | 75% |
| Swiped away | 35% | 72% | 25% |
| Public views | 18,500 | 31,000 | 7,800 |
| Engaged views | 12,000 | 14,000 | 5,700 |
| Average duration | 28 sec | 35 sec | 15 sec |
| Average viewed | 70% | 87.5% | 37.5% |
Short A balances opening response and viewing time. Short B has the largest public counter and strongest retention among engaged viewers, but many feed exposures end in swipes. Its next experiment should target the first seconds without sacrificing the later payoff.
Short C convinces more feed visitors to stay initially, yet its engaged audience watches for less time. Its priority is not necessarily a louder hook. Improving the middle, reducing repetition, or delivering the promised result earlier would be more targeted experiments.
These columns are not interchangeable. Public views may include plays from multiple traffic sources and replays. Do not expect them to equal feed appearances multiplied by chose-to-view percentage. Compare the same traffic source before assuming one opening performs better universally.
How to Find the Numbers in YouTube Studio
- Open YouTube Studio and select Analytics from the left menu.
- Select Content, then choose the Shorts filter for channel-level reporting.
- Review views, traffic sources, Shown in feed, and How viewers engaged where available.
- Open an individual Short to inspect its performance, including retention information where provided.
- Select See more or Advanced Mode to compare videos, dates, and available metrics; export data when useful.
- Open Earn separately when checking progress toward monetization requirements.
Studio layouts differ, and some report cards may be unavailable. Match the selected date range before comparing uploads. Ideally, compare each Short over the same number of days since publication instead of comparing a newly uploaded video with one that has accumulated months of views.
A Simple Troubleshooting Framework
Start with the bottleneck, not the biggest number on screen.
| Pattern | Likely question | Next experiment |
|---|---|---|
| Low feed exposure | Is this reaching interested viewers? | Test clearer topic framing |
| Many swipes | Does the opening communicate value? | Change first frame or first sentence |
| Strong choice, weak duration | Does the middle deliver? | Shorten setup and remove detours |
| Strong duration, few subscribers | Is there a reason to return? | Develop recognizable recurring topics |
These are experiments, not guaranteed fixes. YouTube says Shorts ranking considers choosing to watch, average view duration, average percentage viewed, viewer satisfaction, and personalization. Topic interest and competition also affect reach.
Run one meaningful creative change at a time when possible. Compare multiple uploads in a similar subject and duration range. Avoid declaring victory from a single percentage point or treating another creator’s benchmark as a universal requirement.
Common Analytics Mistakes
One mistake is assuming that a falling public view count signals a penalty. Distribution varies, reports can update after verification, and YouTube can adjust low-quality playbacks. Check feed appearances and traffic sources before drawing conclusions.
Another mistake is equating high average percentage viewed with a successful hook. That statistic describes people who stayed; it must be considered alongside chose to view.
Finally, avoid assuming every playback contributes equally to monetization. Qualified views for eligibility and engaged views for Shorts earnings are not identical to the public number. Review current requirements directly inside Studio.
Frequently Asked Questions
What is a good chose-to-view percentage for Shorts?
YouTube does not publish one universal passing percentage. Evaluate the metric against your own comparable Shorts, considering topic, length, traffic mix, and sample size. A high number without enough feed exposure can still provide limited evidence.
Why are my Shorts views higher than engaged views?
Current public views count play starts and replays without a minimum watch threshold. Engaged views require watching beyond the initial seconds and exclude loops. A gap between the counters is therefore expected.
Can Shorts average percentage viewed exceed 100%?
Yes. Repeated viewing can raise average watch time beyond the original duration. Read that result alongside opening engagement and other metrics rather than assuming every viewer watched twice.
Does swiped away mean the video is bad?
No. A swipe describes a viewing decision, not a complete quality judgment. Audience preferences, the first frame, pacing, and distribution context all matter. Investigate patterns across several videos before making changes.
Do public Shorts views count toward YouTube Partner Program eligibility?
Not automatically. YouTube uses qualified Shorts views for eligibility, with specific exclusions, while Shorts revenue sharing uses engaged views. Consult the Earn tab for your channel’s current progress.
Conclusion
Read Shorts Analytics as a sequence: exposure, decision to watch, and sustained attention. Compare feed distribution, chose-to-view rate, engaged views, and retention together. Then change the part of the video connected to the weakest signal. That approach produces more useful creative decisions than chasing public views alone.
Sources and References
- YouTube Help: How engagement metrics are counted
- YouTube Help: Get started creating YouTube Shorts
- YouTube Help: Understand your YouTube content performance
- YouTube Help: Content tab analytics tips for Shorts
- YouTube Help: Search and discovery tips for Shorts
- YouTube Help: YouTube Partner Program overview and eligibility